


Introduction
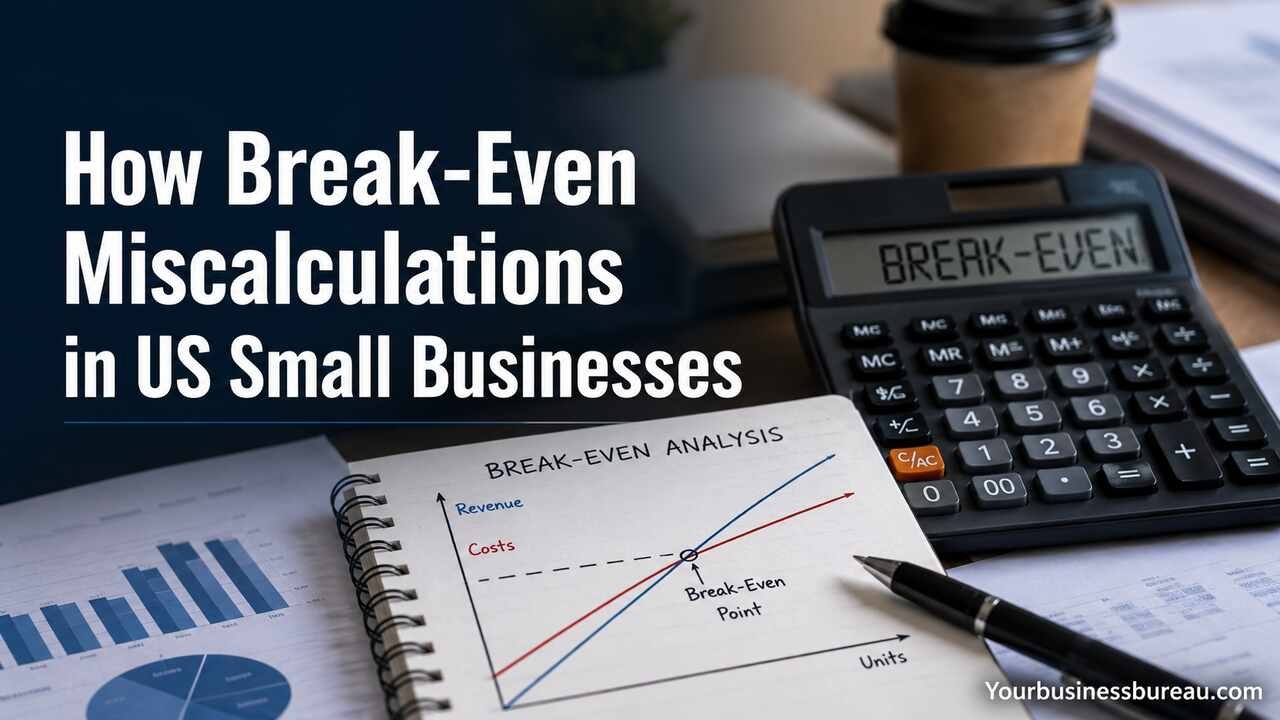
Break-even miscalculations in US small businesses occur when owners inaccurately estimate fixed costs, variable costs, pricing structure, or projected sales volume, which leads to unrealistic profitability expectations and unstable cash flow planning. Break-even analysis defines the exact sales level required to cover total expenses, yet many entrepreneurs rely on assumptions instead of verified financial records. Inaccurate cost classification distorts contribution margins, and distorted margins misguide pricing, budgeting, hiring, and investment decisions. Financial projections built on optimistic demand forecasts often collapse under real market conditions, creating liquidity pressure and unexpected debt reliance. Clear financial modeling, disciplined expense tracking, and realistic revenue forecasting protect small businesses from preventable losses and support sustainable long-term growth.
Why Do US Small Businesses Frequently Miscalculate Break-Even Points?
Break-even miscalculation often begins with incorrect cost classification. Small business owners commonly mix fixed costs and variable costs, which creates distorted financial models. Accurate classification determines contribution margin accuracy, and contribution margin accuracy determines break-even precision. When classification fails, pricing strategy weakens and operational planning suffers.
Many founders rely on estimated monthly expenses rather than real accounting data. Estimates create optimistic projections, and optimistic projections reduce financial preparedness. Real data improves forecasting reliability because real data reflects operational patterns. Entrepreneurs who track historical expenses produce more realistic break-even models.
Psychological bias also influences financial misjudgment. Optimism bias pushes owners to assume higher sales volumes. Higher assumed sales volumes reduce perceived break-even thresholds. Lower perceived thresholds create risky spending decisions. Financial discipline requires separating ambition from measurable numbers.
Incorrect Fixed and Variable Cost Allocation
Fixed costs remain constant regardless of sales volume, while variable costs fluctuate with production or service delivery. Many small businesses classify semi-variable expenses incorrectly, such as utilities or contractor payments. Misclassification inflates contribution margin calculations, and inflated margins reduce break-even accuracy.
For example, rent and insurance remain fixed monthly obligations. Packaging materials and direct labor increase with output. When business owners treat partially variable costs as fixed, the break-even point appears lower than reality. Lower perceived thresholds encourage premature expansion.
Accurate cost behavior analysis requires reviewing at least six to twelve months of expense data. Historical tracking reveals patterns, and patterns reveal cost sensitivity. Financial software improves tracking precision and reduces manual estimation errors.
Overestimating Sales Volume and Market Demand
Sales projections drive break-even outcomes. Unrealistic revenue assumptions distort financial planning. Many entrepreneurs rely on industry averages rather than local demand research. Local demand determines actual sales capacity.
A business may calculate break-even at 1,000 units monthly. If real market demand supports only 700 units, profit never materializes. Owners then experience cash flow stress despite steady sales activity.
Market validation reduces projection errors. Pre-launch surveys, test campaigns, and pilot sales offer real data. Data-driven forecasting replaces hope-driven forecasting. Sustainable growth requires measurable demand rather than aspirational targets.
How Does Break-Even Miscalculation Impact Cash Flow Stability?


Break-even accuracy directly influences liquidity planning. Cash flow depends on timing of revenue and timing of expenses. Even profitable businesses fail when cash inflow does not match cost obligations.
Small businesses often focus on profitability rather than liquidity. Profit represents long-term viability, while cash flow represents survival. When break-even estimates are inaccurate, owners underestimate required working capital.
Unexpected expenses or slower customer payments widen the gap between expected and actual cash position. That gap increases reliance on credit lines, personal savings, or emergency funding.
Working Capital Shortages
Working capital equals current assets minus current liabilities. Break-even miscalculations reduce working capital planning accuracy. Owners expect positive cash generation earlier than reality allows.
When revenue fails to meet projected levels, payroll and supplier payments become stressful. Payment delays damage vendor relationships. Damaged relationships reduce negotiation power and increase operational risk.
Maintaining a three to six month expense reserve improves resilience. Liquidity planning should include conservative sales scenarios rather than best-case assumptions.
Debt Dependency and Financing Pressure
Break-even errors frequently push businesses toward debt. Short-term loans fill liquidity gaps created by optimistic projections. Debt increases fixed financial obligations, which raises the actual break-even point.
Higher interest payments increase monthly cost burden. Increased cost burden requires higher sales to maintain stability. That cycle compounds financial stress.
Responsible financial planning includes conservative break-even modeling and scenario analysis. Scenario analysis tests revenue declines and cost increases to measure sustainability.
Accounting Break-Even Versus Cash Break-Even
A Profitable Agency Facing a Cash Shortage
A small marketing agency has monthly fixed costs of $18,000. Each client project generates an average contribution margin of $3,000, which means the agency must complete six projects per month to reach accounting break-even.
$18,000 ÷ $3,000 = 6 projects
The agency completes six projects in January and records enough revenue to cover its expenses. However, its business clients pay invoices within 45 days. Most of the January revenue may not enter the bank account until March.
Meanwhile, employee salaries, software subscriptions, rent, and contractor payments must still be paid during January and February. The agency may therefore appear to have reached break-even on its income statement while facing a cash shortage in its bank account.
This difference explains why businesses should track both accounting break-even and cash break-even. Invoice collection periods, supplier payment dates, payroll schedules, and customer deposits must be considered when estimating the amount of working capital required.
What Role Does Pricing Strategy Play in Break-Even Errors?
Pricing directly determines contribution margin. Contribution margin determines break-even threshold. Underpricing products reduces margin, and reduced margin increases required sales volume.
Many small businesses set prices based on competitors instead of internal cost structure. Competitive pricing without cost alignment reduces profitability potential.
Strategic pricing balances market demand with cost coverage. Price decisions should reflect value perception and operational sustainability.
Contribution Margin Misunderstanding
Contribution margin equals sales price minus variable cost per unit. Owners often misunderstand which costs truly vary per unit. Misinterpretation leads to incorrect margin calculation.
If a product sells for $50 and variable cost equals $30, contribution margin equals $20. If owner miscalculates variable cost as $25, margin appears $25. That difference changes break-even volume significantly.
Accurate margin analysis requires clear expense categorization. Detailed accounting improves pricing decisions and profitability forecasting.
Discounting and Promotional Pressure
Frequent discounting reduces effective margin. Lower margins raise break-even sales requirements. Many small businesses use discounts to stimulate growth without analyzing margin impact.
Promotional campaigns should include break-even recalculation. If price decreases by 10 percent, sales volume must increase proportionally to maintain contribution stability.
Strategic discounting works only when increased volume compensates for reduced unit profit.
Product Mix Miscalculation
When the Product Mix Changes the Break-Even Point
A retail business sells two products. Its basic product sells for $40 and has a variable cost of $25, producing a contribution margin of $15. Its premium product sells for $90 and has a variable cost of $45, producing a contribution margin of $45.
The owner expects sales to be divided equally between the two products. Under a 50-50 sales mix, the average contribution margin is:
($15 + $45) ÷ 2 = $30 per unit
If monthly fixed costs are $21,000, the estimated break-even point is:
$21,000 ÷ $30 = 700 units
However, actual customers may purchase 80 percent basic products and only 20 percent premium products. The weighted contribution margin then becomes:
($15 × 80%) + ($45 × 20%) = $21 per unit
The revised break-even point is:
$21,000 ÷ $21 = 1,000 units
The company must sell 300 more units than originally expected. Businesses with multiple products should calculate a weighted average contribution margin based on the actual sales mix rather than assuming that every product contributes equally.
How Do Industry Differences Affect Break-Even Calculations in the US?
Industry structure determines cost patterns. Retail, service, manufacturing, and technology businesses operate with different cost ratios. Cost structure influences break-even threshold behavior.
Retail businesses typically carry inventory and face higher variable costs. Service businesses often carry higher labor-related semi-variable expenses. Manufacturing requires equipment investment and depreciation allocation.
Understanding industry benchmarks helps owners align projections realistically.
Retail and E-Commerce Cost Complexity
Retail businesses balance inventory cost, shipping expense, and platform fees. E-commerce businesses add advertising spend as variable acquisition cost. Customer acquisition cost directly impacts margin.
Online advertising increases cost volatility. Paid media campaigns shift break-even levels frequently. Tracking marketing ROI improves forecasting accuracy.
Inventory management also influences break-even stability. Overstock increases holding costs, while understock limits revenue potential.
Service-Based Business Dynamics
Service businesses rely heavily on human labor. Labor cost can behave as semi-fixed when salaried or variable when hourly. Misclassifying labor skews break-even models.
Consulting firms, cleaning services, and creative agencies must evaluate billable utilization rate. Low utilization reduces effective revenue per employee.
Capacity planning becomes central to financial sustainability. Accurate scheduling improves profitability prediction.
E-Commerce Returns and Refunds Example
How Product Returns Raise E-Commerce Break-Even
Consider a hypothetical online clothing store that sells an item for $70. The direct costs connected with each order include:
- Product cost: $25
- Packaging and fulfillment: $7
- Payment-processing fees: $2.50
- Customer acquisition cost: $15
Without considering returns, the contribution margin appears to be:
$70 – $49.50 = $20.50 per order
The store has monthly fixed costs of $20,000, creating an estimated break-even point of approximately 976 orders.
However, after reviewing refund activity, return shipping, damaged packaging, customer support time, and restocking expenses, the owner calculates an additional average return-related cost of $6 per completed order.
The true contribution margin becomes:
$70 – $55.50 = $14.50 per order
The revised break-even point is:
$20,000 ÷ $14.50 = approximately 1,379 orders
Ignoring the average cost of returns caused the business to underestimate its break-even requirement by more than 400 monthly orders. E-commerce companies should convert refunds, replacements, chargebacks, and return-processing expenses into an average cost per order.
How Can Financial Tools Improve Break-Even Accuracy?

Technology enhances financial clarity. Accounting software automates cost tracking and margin reporting. Real-time dashboards provide visibility into revenue trends.
Data accuracy strengthens decision-making. Financial tools reduce manual calculation errors and provide scenario testing capabilities.
Consistent monitoring transforms break-even analysis from a one-time calculation into a continuous management process.
Accounting Software and Automation
Modern bookkeeping platforms categorize expenses automatically. Automated categorization improves cost accuracy. Accurate categorization improves break-even precision.
Financial dashboards display contribution margins and expense ratios visually. Visualization increases owner awareness.
Integration with payment processors and inventory systems improves reporting reliability.
Forecasting and Scenario Modeling
Forecasting tools simulate different sales outcomes. Scenario modeling allows stress testing of financial assumptions.
Owners can evaluate best-case, moderate-case, and worst-case revenue scenarios. Scenario planning prepares businesses for volatility.
Dynamic forecasting supports adaptive strategy instead of static planning.
What Practical Steps Can Small Business Owners Take to Avoid Miscalculations?
Preventing break-even errors requires disciplined financial review. Owners must evaluate monthly financial statements and compare projections to actual performance.
Consistent analysis identifies deviations early. Early detection allows corrective action before financial strain intensifies.
Entrepreneurs who treat financial management as a strategic function improve long-term survival rates.
Conducting Monthly Financial Reviews
Monthly reviews analyze income statement, balance sheet, and cash flow statement. Income statement reveals margin behavior. Cash flow statement reveals liquidity strength.
Variance analysis compares projected numbers with actual results. Significant gaps require investigation.
Regular review builds financial awareness and improves planning accuracy.
Consulting Financial Professionals
Certified Public Accountants and financial advisors provide structured financial insight. Professional review identifies hidden cost patterns.
External perspective reduces emotional bias in projections. Collaboration improves accountability.
Professional guidance supports tax optimization and compliance, which further protects financial health.
What Are the Long-Term Consequences of Persistent Break-Even Errors?
Chronic miscalculation erodes profitability gradually. Continuous underestimation of costs reduces reinvestment capacity. Reduced reinvestment limits growth potential.
Investor confidence declines when projections consistently fail. Financing opportunities shrink when lenders perceive instability.
Sustainable success requires financial realism and disciplined modeling.
Impact on Business Valuation
Business valuation depends on consistent earnings and predictable cash flow. Break-even inaccuracies create unstable earnings patterns.
Valuation models rely on EBITDA and revenue growth reliability. Inconsistent margins reduce valuation multiples.
Financial credibility influences exit opportunities and acquisition interest.
Strategic Growth Limitations
Expansion requires capital and operational clarity. Break-even uncertainty limits strategic risk-taking.
Owners hesitate to scale when financial baseline remains unclear. Conservative growth protects survival but restricts potential.
Accurate break-even modeling supports confident expansion decisions.
My Experience and Direct Advice to You
When I speak to small business owners about break-even analysis, I often notice overconfidence in early projections. I have worked with founders who believed profitability would arrive within three months, yet cost structure required double the projected sales volume. Honest financial review transformed those businesses from reactive to proactive.
I encourage you to open your financial statements and review cost categories carefully. Review every recurring payment. Ask whether each expense behaves as fixed or variable. Precision in that classification will change your financial clarity immediately.
Financial awareness empowers decision-making. You deserve predictable growth rather than financial surprises. Break-even analysis serves as a stability compass, and disciplined modeling builds sustainable confidence.
Comparative Overview of Common Break-Even Risk Factors
| Risk Factor | Financial Impact | Long-Term Effect |
| Misclassified Costs | Incorrect margin calculation | Profit erosion |
| Overestimated Sales | Liquidity shortages | Debt reliance |
| Excessive Discounting | Lower contribution margin | Higher volume pressure |
| Weak Cash Flow Planning | Payment delays | Vendor relationship strain |
Break-Even Calculation Components Overview
| Component | Definition | Role in Profitability |
| Fixed Costs | Expenses that remain constant | Determine base cost burden |
| Variable Costs | Costs tied to production or sales | Influence contribution margin |
| Contribution Margin | Revenue minus variable cost | Defines sales required |
| Sales Volume | Units sold | Drives revenue potential |
Conclusion
Break-even miscalculations in US small businesses undermine pricing strategy, cash flow management, and long-term growth. Accurate cost classification, realistic sales forecasting, disciplined pricing, and ongoing financial review strengthen sustainability. Financial clarity transforms uncertainty into strategic advantage. Owners who adopt data-driven modeling reduce risk, improve valuation, and enhance operational confidence. Break-even analysis should function as a continuous management system rather than a one-time startup calculation. Sustainable success depends on measurable numbers rather than optimistic projections.
FAQ’s
Break-even point equals fixed costs divided by contribution margin per unit. Contribution margin equals selling price minus variable cost per unit.
Many owners misclassify costs, overestimate demand, and underestimate operating expenses, which distorts financial projections.
Quarterly updates provide strong oversight, while monthly reviews improve precision in fast-changing industries.
Software reduces errors but requires accurate data entry and consistent monitoring to remain reliable.
Break-even analysis identifies minimum sales needed to avoid losses. Profitability depends on maintaining margins above that threshold consistently.


